Comparing Several Analytical Methods When Determining Dynamic …
Mock Artery Compliance
by | SFB 2005 | Publications, Compliance, Silicone Mock Arteries
Comparing Several Analytical Methods When Determining Dynamic Compliance of Arteries and Vascular Grafts
Ramesh, R1, Conti JC2
1 University of Kansas, Department of Mechanical Engineering, Lawrence KS 66046
2 Department of Physics, Astronomy and Material Sciences, Southwest Missouri State University, Springfield, MO, 65803
SFB 2005
Introduction
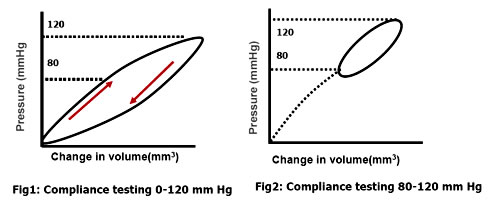
Proper evaluation of mechanical characteristics of intravascular medical products often makes it necessary for researchers to conduct animal studies. Silicone mock arteries used in medical device testing have been proven to be the better alternative to animals. Radial compliance of mock arteries depends on radius and internal pressure and plays a critical role in in vitro experiments. Mock arteries are tested for radial compliance according to standards set by the AAMI/ISO committee; usually mock arteries are tested dynamically from 0mm Hg pressure to a pressure greater than 120mm Hg. In calculating the radial compliance, the volumes at the pressure range 80-120mm Hg (normal blood pressure of human arteries) are used to calculate the radius of the mock artery at 80 and 120 mm Hg. These radii are then used in calculating the compliance of the mock arteries. In vivo, arteries undergo a cyclic load between 80-120 mm Hg pressure. This makes it absolutely necessary to test and determine the compliance of the mock arteries in this pressure range.
The objective of this study is to dynamically test the mock arteries between the 80-120mm Hg pressure range and determine the compliance within this pressure range. This involves estimating the volume change in mock arteries from 0mm Hg to 80mm Hg and calculating the compliance between 80-120mm Hg. This study used an analytical approach in determining the volume change of the mock artery from 0-80 mm Hg. Two different methods were used to analyze the data obtained for the pressure range 0-120 mm Hg and 80-120 mm Hg.
Materials and Methods
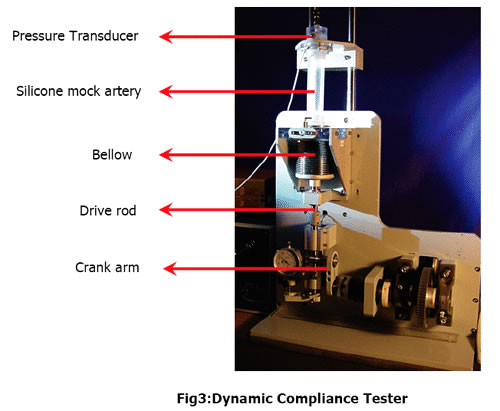
Six silicone mock arteries with different diameters and compliances ranging from 2% to 22 % were tested using the Dynamic Compliance Tester (DCT). Testing was done in accordance with AAMI/ISO standards at 60bpm.
Princible of Measuring Radial Compliance:
To determine the radial compliance of the tube (mock artery), the initial length (Li) and the initial radius (Ri) of the tube has to be measured; in other words, the initial volume (Vi) of the tube has to be determined.
Vi = Π ×Ri2 ×Li
(Vi is the volume at 0 mm Hg pressure.)
If the tube is then inflated to a new pressure P2 with the length being fixed (there is minimum change in length Li), a new set of dimensions results for the tube depending on its compliance. Let ∆V be the change in volume; therefore, the final volume Vf of the tube at pressure P2 is given by:
Vf = Vi +∆ V
Vf = Π × Rf2×Li (where Rf is the radius at pressure P2)
Rf = sqrt (Vf / (Π ×Li))
% radial compliance is given by ((Rf-Ri) / (Ri × ∆P)) × 104
where ∆ P is change in pressure expressed in mm Hg.
Mock arteries were compliance tested three times in the pressure range 0-120mm Hg and 80-120mm Hg using DCT.
A second-degree polynomial curve was used to fit the pressure -volume data points. An extrapolation of the curve back to 0mm Hg was done to determine the volume change from 0mm to 80 mm Hg. This was necessary for the 80-120 mm Hg type of compliance testing.


Pressure -volume curves for 0-120mm Hg and 80-120 mm Hg were analyzed using two methods: One method involves determining the volume at 80mm Hg and 120 mm Hg and calculating the compliance. This method of calculating the compliance using volumes at two different conditions is called Conditional compliance.
The second method, called Regression compliance, involves calculating the radii at all the volume points; the slope of the pressure- radii curve is determined using regression analysis. This slope is later used in calculating the compliance of mock arteries.

| Tube No |
ID (mm) |
Sample Length (mm) |
Trial No | Percentage Compliance (mm Hg)-1 | ||||
| 0-120 mm Hg | 80-120 mm Hg | |||||||
| Regression Analysis | Conditional Compliance | Regression Analysis | Conditional Compliance | |||||
| 1 | 10.85 | 91 |
1 2 3 |
3.5314 3.5464 3.6536 |
3.5070 2.8126 3.5363 |
3.0887 3.1111 3.0730 |
3.0980 3.1306 3.0503 |
|
|
Mean Std Dev |
3.5771 0.0666 |
3.2853 0.4096 |
3.0909 0.0192 |
3.0930 0.0404 |
||||
| 2 | 18.23 | 88 |
1 2 3 |
—– 5.7676 5.8384 |
5.5959 5.6705 5.7013 |
5.3550 —– 5.5460 |
5.4507 —– 5.5391 |
|
|
Mean Std Dev |
5.8030 0.0501 |
5.6559 0.0542 |
5.4505 0.1351 |
5.4949 0.0625 |
||||
| 3 | 15.74 | 91 |
1 2 3 |
6.3075 6.1959 6.4586 |
6.9130 6.0508 6.1171 |
5.8186 6.5977 6.3111 |
5.8346 6.0842 6.0295 |
|
|
Mean Std Dev |
6.3207 0.1318 |
6.3603 0.4798 |
6.2425 0.3940 |
5.9828 0.1312 |
||||
| 4 | 19.71 | 88 |
1 2 3 |
8.3113 8.1353 8.2488 |
8.2134 7.9140 8.3334 |
7.6103 7.3897 7.3866 |
7.6184 7.3977 7.4028 |
|
|
Mean Std Dev |
8.2318 0.0892 |
8.1536 0.2160 |
7.4622 0.1283 |
7.4730 0.1260 |
||||
| 5 | 16.37 | 90 |
1 2 3 |
12.1968 12.1565 12.4107 |
12.3227 12.4005 12.4868 |
10.7852 10.8254 11.1356 |
10.5811 10.7020 10.7568 |
|
|
Mean Std Dev |
12.2547 0.1366 |
12.4033 0.0821 |
10.9154 0.1918 |
10.6800 0.0899 |
||||
| 6 | 19.35 | 88 |
1 2 3 |
22.8856 22.7638 22.9375 |
22.6571 23.6571 23.4210 |
19.3843 19.8749 19.6696 |
18.9603 19.4952 19.2704 |
|
|
Mean Std Dev |
22.8623 0.0892 |
23.1101 0.4013 |
19.6429 0.2464 |
19.2419 0.2686 |
||||
Fig6: Compliance test results of six mock arteries
Results and Discussion
Analysis of the results showed that there is a difference in the calculated compliance of the mock arteries analyzed by two different methods. This difference was lesser in lower compliance tubes, but became more pronounced in mock arteries of higher compliances. A fixed pattern for this difference could not be established. It was clear from the analysis that the compliance values obtained from 0-120mm Hg pressure range was greater then the 80-120mm Hg pressure range. This difference became significant in the mock arteries of higher compliances.
Conclusion
This study shows that mock arteries can be tested for compliance between the 80-120mm Hg pressure range. The compliance values were reasonably repeatable. Further investigation for this hypothesis will be done with high speed photographic analysis.
Acknowledgements
Special thanks to all employees of Dynatek Dalta Scientific Instruments .
References
Conti, J.C. and Strope, E.R., Radial Compliance of Natural and Mock Arteries: How this Property Defines the Cyclic Loading of Deployed Vascular Stents. Biomedical Sciences Instrumentation, 38, 163-171, (2002)
Conti, J.C., Strope, E.R., Rhode, D.J. and Spence, L.D., Frequency Dependent Radial Compliance of Latex Tubing. Biomedical Sciences Instrumentation, 33, 524-529 (1997)
Conti, J.C., Strope, E.R., Rohde, D.J. and Greisler, H.P., A New Technique to Determine Vascular Compliance In Vivo , National Heart Lung and Blood Institute Contractors Meeting. Louisvelle , KY , 1989
Gonza, E.R., Mason, W.F., Marble, A.E., and others, Necessity for Elastic Properties in Synthetic Arterial Grafts. Can. J. Surg., 17,176-179 (1974)
AAMI/ISO standard ISO/CD- V-1 25539-01:2003 and ANSI/AAMI VP-20, 1994


