Methods of Particulate Analysis
ISO/AAMI recommends two methods for the analysis of particulates shed by vascular stents and stent-grafts, balloons and delivery catheters in liquids:
i. Light obscuration, and
ii. Microscopic analysis1
Dynatek’s patented CDT-5 and CDT-20 Coating Durability Testers and the Acute Particulate Tester feature particle counters that utilize the light obscuration method to count particles shed by vascular devices into liquids. For more information on the CDT’s particle counters, see Reference 2.
Chemical and Elemental Analysis of Particulates
Scanning Electron Microscope (SEM) analysis of particles shed into liquids can be used to count and identify particles from the entire extraction effluent if the particles are captured by an appropriate filter. SEM analysis has the following benefits:
i. Particles captured on a filter membrane can be re-examined again at a later time
ii. Fourier Transform Infrared/Raman spectroscopy can provide molecular information
iii. If Energy Dispersive X-Ray spectroscopy (EDX) of particles is performed, the elemental composition of the particle may be determined
iv. SEM analysis is unaffected by bubbles in the sample liquid
Particulate Analysis by SEM
Dynatek routinely counts particles shed by stents during testing on the CDTs using laser-based particle counters. With these testers each sample is analyzed separately, allowing assignment of shed particles to a unique device. To evaluate the efficiency of particulate capture on the filters, we injected standard particles into a CDT, captured them on a filter and had them analyzed by SEM.
Methodology:
Filters used: Membrane filter, 5 μ pore size, 47 mm dia. Rinse water: HPLC grade water Standard particles used: 10 and 25 μm particles Tester: Acute Particulate Tester, running CDT software V8.1, with calibrated particle counter inline with the tester tubing. Phosphate buffered saline (PBS) was the testing fluid of choice, at 37 °C.
Experiment:
A 0.1 ml aliquot containing approximately 300 standard 10 μm particles in HPLC grade water was injected with a syringe into the entry port of the Acute Particulate Tester (APT) via a Tuohy-Borst fitting, followed by another injection of approximately 300 standard 25 μm particles.
The APT system was configured as follows: catheter access > tortuous path > debubbler > splitter > sensors > filters in a 47mm filter housing. The fluid particles were carried by the PBS to the laser-based particle counter that was installed downstream of the tubing. After counting was completed, the fluid along with the particles entered a dedicated filter housing containing the filter membrane.
The particles were captured by the filter membrane, while the PBS filtrate was recirculated into the APT after passing through a 0.2 μm system filter.
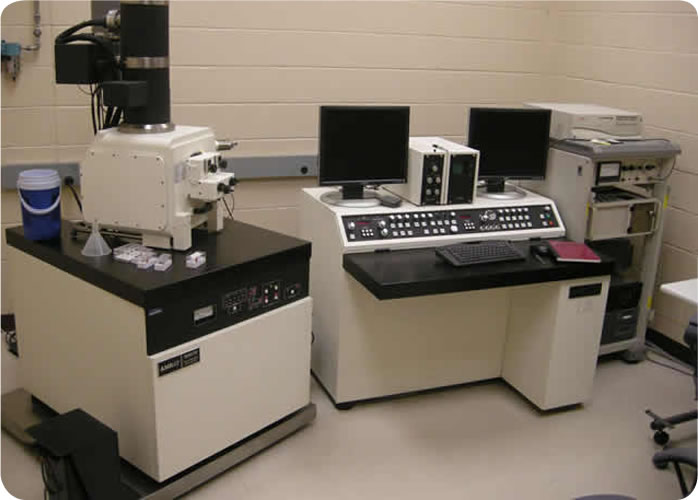
After counting was completed, the filter, while still in its housing, was rinsed with 500 ml of HPLC grade water to prevent salt crystallization on the filter membrane. The filter membrane was then removed from its housing, packaged carefully and couriered to our SEM vendor. SEM analysis was performed with a digital Amray 1850 FE Scanning Electron Microscope (Fig. 1) under vacuum at 20 keV.

Results:
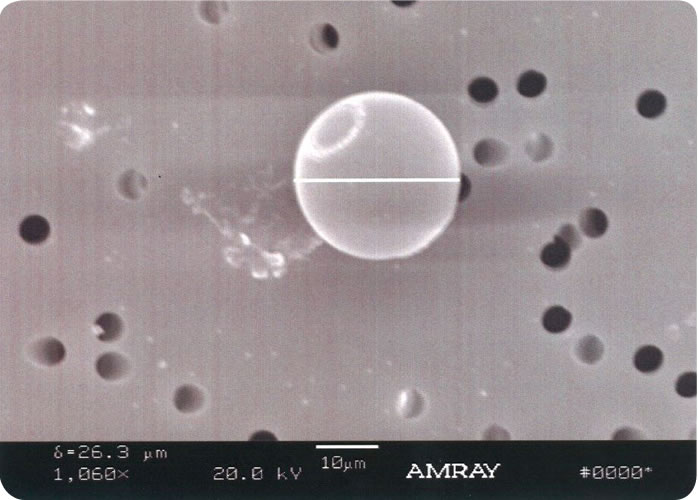
The laser counter in the APT counted 280 particles of 10 μm size and 240 particles of the 25 μm size. SEM counts were 273 particles of the 10 μm size and 238 particles of the 25 μm size (Table 1). An image of the 25 μm standard particle can be seen in Fig. 2.
Conclusion:
SEM counts of standard particles were very similar to counts obtained with Dynatek’s laserbased particle counts, showing our filtration captures greater than 97% of counted particles.
Particle Size, μm 10 25
Laser counts 280 240
SEM counts 273 238
% difference 2.5 0.8

Elemental and Chemical Analysis
While the results described above were for standard particles of a known composition, a key advantage of SEM analysis is elemental and chemical analysis of the particulate material shed by intravascular devices.
EDX and FTIR provide a valuable method by which particulates shed by the stent can be elementally and chemically identified and sourced to their point of origin.
Dynatek offers particle capture with follow up SEM analysis to its customers.
References
1. AAMI TIR42:2010. Evaluation of particulates associated with vascular medical devices.
2. Particle Counters for Stent Coating Durability Testers. Dynatek Labs, Inc., December, 2013.


