The Cyclic Texture Profile Analysis of Mozzarella Cheese: Evaluating
Food Analysis
by | IFT 1999 | Publications, Food Analysis
The Cyclic Texture Profile Analysis of Mozzarella Cheese: Evaluating the Rate of Textural Change (RTC)
Annual Meeting of the Institute of Food Technologists, Book of Abstracts, 80, (1999)
J.C. CONTI1, E.R. Strope, F. Schmidt
Dynatek Dalta Scientific Instruments, P.O. Box 254, Galena, MO 65656
1 SMSU Department of Physics, Springfield, MO
IFT 1999
Justification:
The texture of mozzarella cheese is important for the development of formulations needed to fulfill increased demand. There are problems correlating sensory panels and mechanical testing. Multiple chew data better characterize textural properties.
Objective:
To develop techniques that evaluate multiple chew texture profile analysis.
Methods:
Twenty-four samples of Kraft mozzarella were subjected to multiple (10) chew texture profile analysis at 70°F. The cheese was mounted inside a latex tube of similar diameter to the cheese plug (3mm diameter by 6mm long) and with a radial compliance of 2% per psi. The tube/cheese sample was subsequently mounted onto the bottom rod of a Latour-Black cyclic texture tester. The upper tooth was lowered until it contacted the cheese.
Testing reduced the total height of the sample by 80% (4.8mm). After each compression or chew, the upper tooth was withdrawn to the initial position. The elastic latex tube delivered the chewed cheese back into the chewing path. Ten chews were completed. The peak hardness of each chew was determined.
Results:
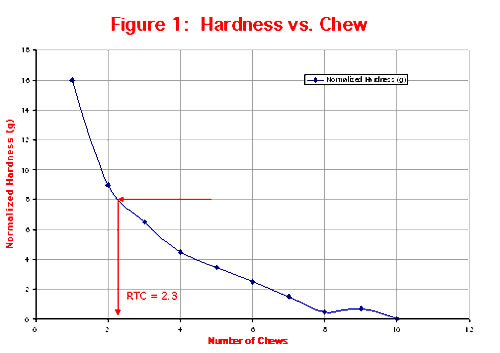
Average hardness at first chew was 44 grams. Hardness dropped with each additional chew until, at the eighth, ninth or tenth chew, the hardness was 28 grams, indicating a leveling out of hardness versus chew. (See Table 1.) Subtracting 28 grams from the hardness of each of the chews produces a normalized hardness curve (Figure 1). The normalized hardness (grams) at each chew was: 16, 9, 6.5, 4.5, 3.5, 2.5, 1.5, 0.5, 0.7, and 0. An analysis of the hardness data indicates that the normalized hardness is changing by half for each 2.3 chews that the sample receives.

Table 1
Chew |
Hardness (g) |
Normalized Hardness (g) |
|
1
|
44
|
16
|
|
2
|
37
|
9
|
|
3
|
34.5
|
6.5
|
|
4
|
32.5
|
4.5
|
|
5
|
31.5
|
3.5
|
|
6
|
30.5
|
2.5
|
|
7
|
29.5
|
1.5
|
|
8
|
28.5
|
0.5
|
|
9
|
28.7
|
0.7
|
|
10
|
28
|
0
|
Signifcance:
These data show that mozzarella cheese has a rate of textural change (RTC) of 2.3 (hardness reduces by half for each 2.3 chews). Food studies can benefit greatly by understanding how single point testing is not as relevant as the rate of change of the texture of a food sample.
Comments:
Food panels that have been assembled at our facility have inevitably yielded data that do not correlate with standard Texture Profile Analysis tests that have been run simultaneously. Although minimally trained, our human “chewers” were no more unreliable that most panels. When the results of the above RTC experiments were compared to panel results, correlations were improved.
It seems that people have a certain expectation of textural change as well as absolute textural properties. Foods that change texture rapidly, such as potato chips, are pleasing if the first hardness number is in the proper range, but a non-changing chip is unpleasant. Intermediate RTC food, such as steak, elicits expectations of a much differently changing textural profile. Indeed, significant deviation from an expected RTC provokes an unpleasant response.
We are now working to evaluate the RTC of several food groups and hope to correlate these results with those from more professionally trained sensory panels.


