The Comprehensive Validation of a Stent Coating Durability Tester
Particle Counting
by | RMBS 2009 | Publications, Particle Counting
The Comprehensive Validation of a Stent Coating Durability Tester
Ramesh R1, Conti JC1, 2 , Strope ER1
1 Dynatek Dalta Scientific Instruments, 105 E Fourth St, Galena, MO 65656
2 Department of Physics, Astronomy and Material Sciences, Missouri State University, Springfield, MO 65803
US Patent # 9,453,788 B2
RMBS 2009
Abstract
This study addresses the need to develop an instrument and supporting protocol to evaluate the tendency for a bare or drug coated stent to shed particles into the vasculature of a patient. The resultant experiments demonstrated that two types of instruments each properly detected, sized and counted better than 90% of the injected calibration particles within four minutes.
Keywords
stent, coating, durability, particles, counting, validation
Introduction
Most regulatory agencies worldwide are beginning to realize that one of the pieces of information that is important during the approval of a medical device is the propensity for that device to shed particles. There is a large body of information in the literature to support this. [1-43] A recent article describes an instrument and protocol to address these needs. [44]
This paper specifically addresses validation steps to insure the reliability of particle assessment in these instruments.
During the design phase several questions arose that needed to be addressed:
Is the particle counter capable of accurately counting and sizing the shed particles?
Does the durability tester deliver all the shed particles to the particle counter?
Does the particle counter detect the shed particles in a reasonable amount of time?
Does the filtration system remove all the particles from the flow loop after the experimental fluid exits the particle counter?
The Coating Durability Tester Type 1 (CDT1) (Fig 1) and Coating Durability Tester Type 2 (CDT2) (Fig 2) were designed to detect particles that have been shed from coated vascular stent samples exposed to pulsatile forward flow conditions. The stents are tested in a pulsatile environment in straight, curved and bifurcated vessel configurations in order to represent loading on the stent similar to in vivo conditions, but at accelerated pulse rates of up to 60Hz. Cyclic radial expansion of the stent is controlled to approximate physiological conditions. This validation test was designed to approximate conditions that would be experienced by a coated stent, followed by injection of a known quantity of accurately sized particles at the location where the coated stents would be deployed. Particle counts were monitored after injection of the particle suspension, and the logged particle counts were then compared to the theoretical injected counts for evaluation against the acceptability criteria. The goal was to attain 90% recovery within a reasonable period of time.
Materials
The CDT1 is a horizontally-oriented device and utilizes a DC motor to produce a rotation on a boring head that is attached to a drive compressing a single bellows. Adjustment of the boring head allows for modification of the volume injected into the samples mounted in the CDT1, and therefore allows for modification of the radial expansion of the device. The CDT2 is a vertically-oriented device that utilizes an electromagnetic motor whose motion is controlled by a signal generator and an amplifier.
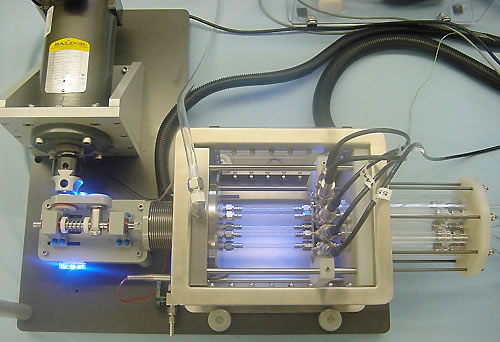
Figure 1 – CDT1 Test Mechanism
With both the instruments, systemic pressure is controlled by the CDT software and maintained by pressurization of the capacitance tank. Speed, temperature, cycle counts, pressures and particle counts are monitored and logged by the CDT software. Particle counts are monitored in the particle counter, and logged at intervals established in the CDT software. Particles are identified by size and logged by raw counts into bins with size ranges established by the user. In this case, bins covering particles sizes 7-13, 13-15, 15-35, 35-50, 50-90, and above 90 microns were used. Particles of sizes 4-50 microns may be identified by size in intervals of 1 micron. Particles of sizes 51-100 micron may be identified by size in intervals of 5 microns. Particles greater than 100 micron in size are identified as >100 microns. The upper size limit for counting is 1000 microns. The particle counters are calibrated by the manufacturer at six-month intervals per U.S. Pharmacopeia <788> standard for Particulate Matter in Injections. Certificates of calibration are provided by the manufacturer.
Duke Scientifics’ (Palo Alto, CA) COUNT-CAL Count Precision Standard (NIST traceable size standards) was utilized for injection of particles into the tester. These polystyrene microsphere suspensions are guaranteed at 3000 particles per milliliter (± 10%) by Duke Scientific Corporation, and certificates of validation are provided with each lot of suspension. For these CDT tests, particles of three sizes were utilized: 10 microns, 25 microns and 70 microns. These are nominal sizes specified by Duke Scientific. However, instructions for use accompanying these particle suspensions indicate that the user should begin counting particles with sizes smaller than the nominal diameter indicated on the suspension.
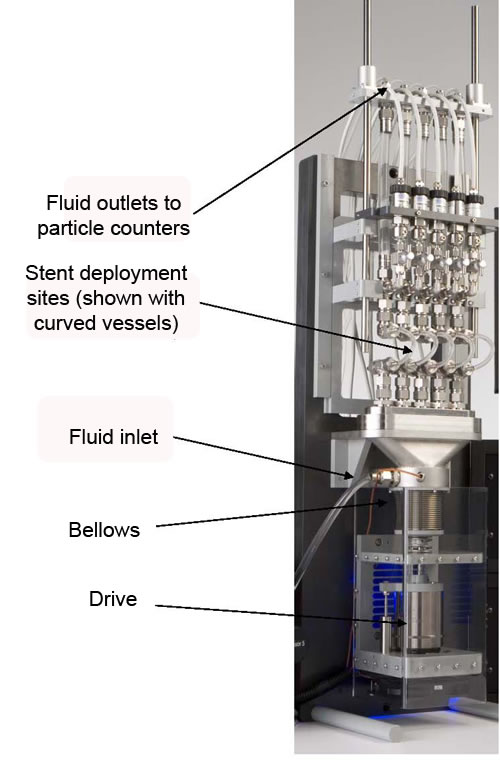
Figure 2 – CDT2 Test Mechanism
Methods
In order to evaluate several potential scenarios, the following groups of experiments were carried out. On the CDT1 straight (Fig 3) and curved (radius of curvature of 15mm) (Fig 4) mock arteries were used, while on the CDT2 bifurcated samples were modeled (Fig 5). The testers were run between 4 and 6 million cycles until the counts were reduced to less than one count on each per 25,000 cycles. This is referred to as the clean-out phase and establishes a baseline for regular experiments.
Site of particle Injection – Before the start of the test, the straight sample tubes were cut in half and attached to a “T“ fitting, which attaches to a Luer Loktm fitting with a valve. A syringe (1ml) was used to inject the particles (Figure 6).
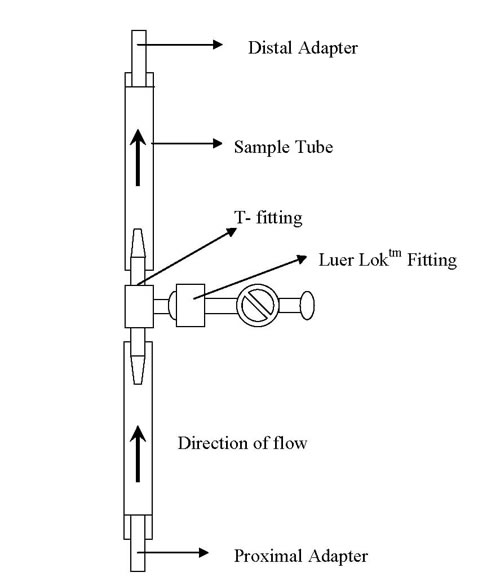
Figure 3 – Straight Mock Vessel Mounting Configuration
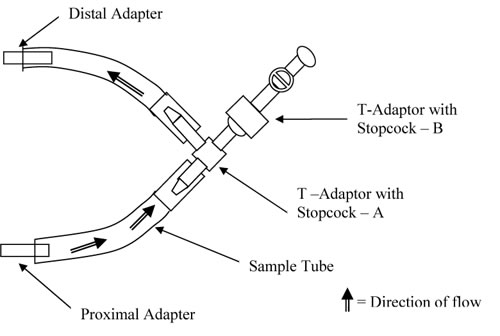
Figure 4 – Curved Mock Vessel Mounting Configuration
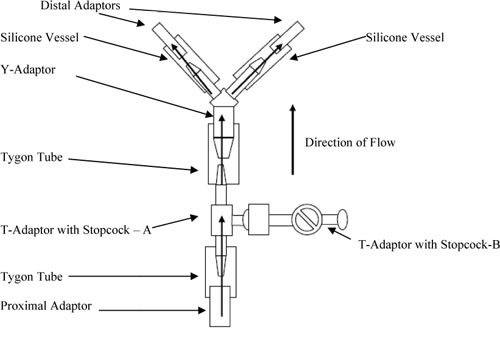
Figure 5 – Bifurcated Mock Vessel Mounting Configuration
The sample (sample defined in this case as the combination of the Tygon tube and T-adaptor with stopcock – A) was mounted where the testing fluid flows from the proximal manifold, though the stopcock, and continues along the same path to the particle counters as the fluid would flow in a test on coated stents. A second T-adaptor with stopcock with one male and two female Luer-Loktm fittings was mounted onto the first T-adaptor (Figure 7 and 8). This is the site where particles were injected, and is also the site where coated stents would be placed during coating durability tests. Therefore, the injection of particles occurred at the site of theoretical particle generation during coating durability testing.
The tester was started and parameters were set to the approximate conditions used during a coating durability test. Testing parameters were as follows:
• Pulsation speed: 40Hz ± 1Hz for CDT1; 60Hz ± 1 Hz for CDT2
• Temperature: 37º ± 2 ºC
• Fluid flow through samples: 100mL/min ± 5mL/min
The tester was started and allowed to run a minimum of 24 hours to allow for establishment of baseline particle counts.
After the initial clean-out period, particle injections were started using techniques recommended by Duke Scientific and developed by Dynatek dalta Scientific Instruments. Samples included injections of 3000 particles per 1mL injection, 1500 particles per 0.5mL injection, and 300 particles per 0.1mL injection. The following techniques were used for particle injections.
Approximately 30mL of sample solution (phosphate buffered saline solution) was removed from the tester via the access T-adaptor and placed into a sterile beaker. Using a tuberculin syringe, this solution was used to prime the Luer-Loktm syringes and Luer-Loktm ports used for particle injections in order to prevent air injection into the system.
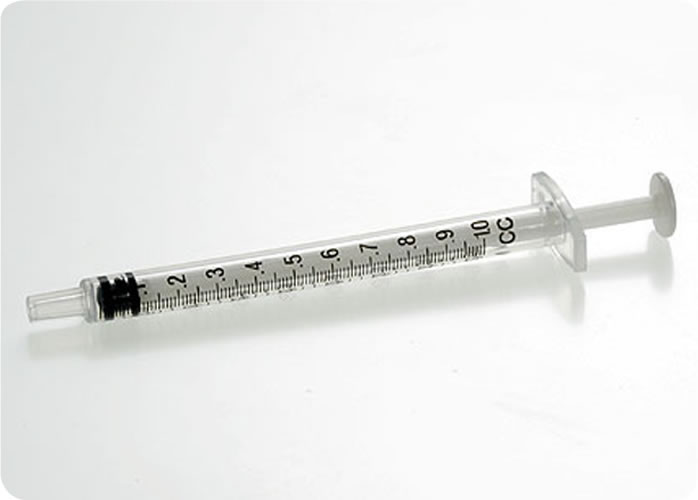
Tuberculin Syringe
Luer-Lok tm Port for Injection with Female Attachment
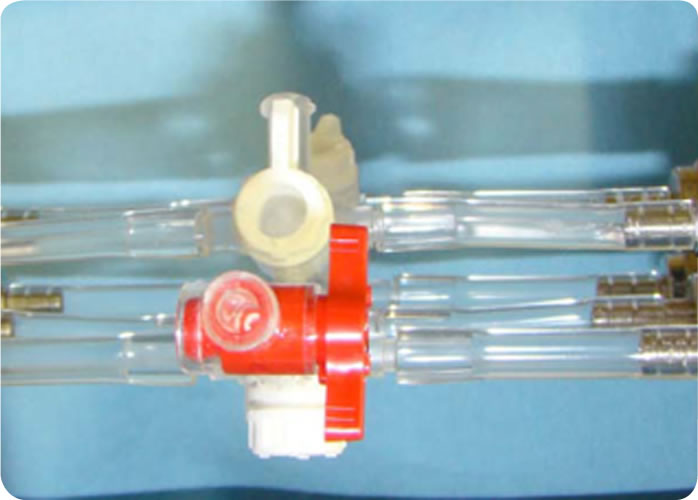
Figure 6 – Photos of Straight Mock Vessel Mounting Configuration and Tuberculin Syringe
A 1mL sample syringe with Luer-Loktm tip was used as the test syringe for injecting particles. To remove air from the tip of the sample syringe barrel, the sample syringe plunger was pressed firmly into the syringe body and the Luer-Loktm tip was filled with sample solution from the tuberculin syringe. This was to prevent air bubble intrusion during the solution drawing process into the test syringe.
Luer-Lok tm Syringe with Male Attachment
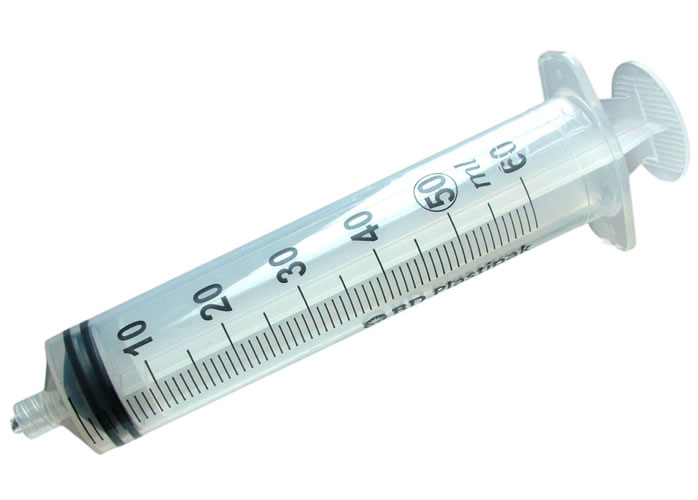
Tip of Luer-Lok tm syringe filled using tuberculin syringe
Figure 7 – Photo of Luer-Loktm Syringe Tip To Be Filled with Tuberculin Syringe
Preparation – The Luer-Loktm syringe was mounted onto the access port of the sample and 1.1mL of fluid was drawn from the tester over five seconds. This fluid was then injected back into the tester over five seconds. This was repeated three times to prime the syringe. Finally, the test syringe was filled with sample solution and removed. The syringe was remounted onto the access port of the sample. The port was opened and a reading was taken to evaluate influence of the mounting of the syringe on particle counts. 1 mL of the solution was injected into the system (without plunger being squeezed too hard in the end) over five seconds, then two 1mL draws and injections were performed, each over five seconds. This allows for evaluation of particle counts due to blank (no added particles) injection. The access port was closed and the test syringe was removed from the system.
Particle Injection – For the 3000 particle injection, 1.05 mL of particle standard was drawn from the count standard bottle, after the solution was mixed according to manufacturer’s recommendations. This mixing requires a slow rotation of the standard sample bottle for 10 rotations over 60 seconds. Some solution was ejected out of the test syringe until the plunger line was at the 1mL mark. A hemispheric meniscus on the tip of the syringe outlet was obtained. The tuberculin syringe with sample solution previously obtained was used to fill the access port until a hemispheric meniscus is obtained.
Luer-Lok tm Stopcock
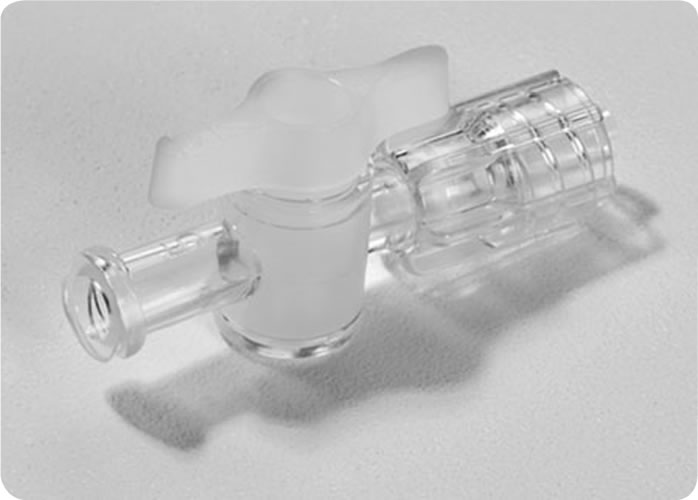
Stopcock tip filled using tuberculin syringe
Figure 8 – Photo of Stopcock Tip To Be Filled With Tuberculin Syringe
Test syringe was inserted into the access port and the port was opened. A single reading was then noted to make sure the system had returned to baseline. The sample containing particles from the test syringe was injected over a five second period. The solution from the tester was drawn back into the test syringe over five seconds. This was injected back into the tester over five seconds, repeating the process of filling and injecting the solution to ensure delivery of all particles into the tester. The particle count in the respective bin increased as the particles flowed through the sensor and then dropped down to baseline counts after all particles had passed through the sensor. The access port was closed and test syringe was removed. Particle Injection was repeated a minimum of three additional times with the same particle size.
Following completion of injections for a single particle size, the preparation and particle injection sections above were repeated with the different particle sizes.
Following completion of injections of all particle sizes in the straight tube, preparation and particle injections sections above were repeated with the curved and bifurcated tubing configurations.
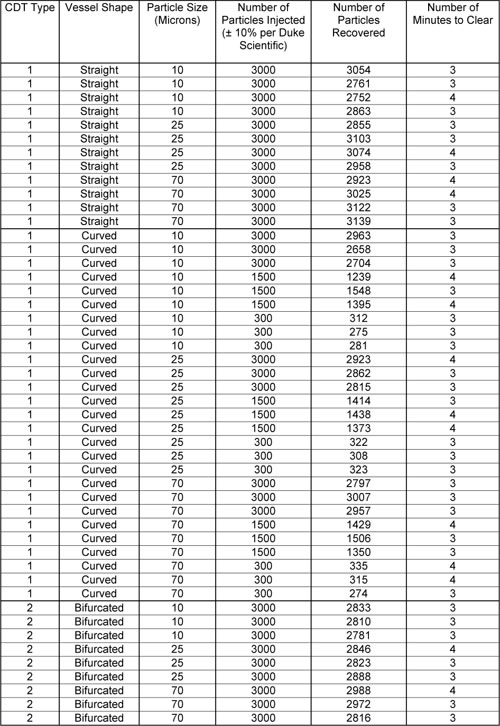
Results Following particle injection, particle counts in the relevant bin range (based on injected particle size) were monitored and documented from the time of injection until the counts returned to baseline. This typically encompassed three 60-second data logging intervals. The sum of particle counts in the relevant bin range over the applicable data log intervals were used for comparison to the injected quantity of particles.
Particle counts from the blank injection of the test procedure were expected not to be statistically significant, and not to be greater that 1% of the intended quantity of particle standard injected. If these counts had exceed 1% of the intended injected quantity, the particles introduced as an artifact of the injection process may have been subtracted from the total quantity identified after the injection of the particle standard. This particle count subtraction was not necessary in this validation test.
Particle counts for each particle size and each concentration were averaged, except that the first injection for 10 and 25 micron particles, and the last injection for 70 micron particles was excluded, per Duke Scientifics’ instructions for use.
The following table includes the actual recovery rates for each analyzed injection.
Table 1 – Actual Recovery Rates For Injected Particles
The following graphical representation of the collected data for the 3000 particle injections is shown for bifurcated, straight and curved tubes for each size particle (Figure 9).
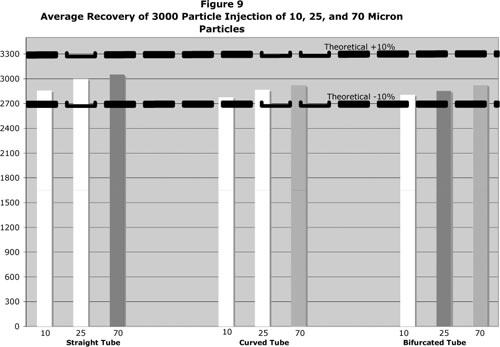
Relevant injections were averaged, and the average recovery rate was compared against the theoretical 3000 particle quantity. The average percent recovery for all sizes fell within ± 10% of the theoretical.
Discussion
The concern for the delivery of particulates from medical devices into patients will only grow with time. The assessment of these shed particles depends not only on the functioning of the particle counter but also on the assurance that the testing instrument itself delivers all of these shed particles to the particle counter in a relatively short period of time. The detailed steps in the above protocol, if carefully carried out, ensures complete delivery of injected particles without the artifact of injected air bubbles, thus yielding an accurate particle analysis. It also gives an understanding of the time course of shed particles. This time course will have an impact on any negative biological effects that the shed particles might evoke. These calibration/ validation protocols will assist in this analysis.
References
1. Service, F.R., Nanotubes: The Next Asbestos?, Science, 281(5379): 941, Aug 1995
2. Kowandy, C., Mazouz, H., Richard, C., Isolation and Analysis of Articular Joints Wear Debris Generated Invitro, Wear, 261(9): 966-970, Nov 2006
3. Goodman, S., Wear Particulate and Osteolysis, Orthopedic Clinics of North America, 36(1): 41-48, Jan 2005
4. Lewis, L. P., Fracs, B. S., Brewster, T. N., Graves, S., The Pathogenesis of Bone Loss Following Total Knee Arthroplasty, Orthopedic Clinics of North America, 29(2):187-197, Apr 1998
5. Howell, J. R., Blunt, L. A., Doyle, C., Hooper, R. M., Lee, A. J. C., Ling, R. S. M., In vivo Surface Wear Mechanisms of Femoral Components of Cemented Total Hip Arthroplasties- The Influence of Wear Mechanism on Clinical outcome, The Journal of Arthroplasty, 19(1): 88-101, Jan 2004
6. McMullin, T. B., Leung, Y. M., Shanbhag, S. A., McNulty, D., Mabrey, D. J., Agrawal, C. M., Correlating Subjective and Objective Descriptors of Ultra High Molecular Weight Wear Particles from Total Joint Prostheses, Biomaterials, 27(5): 752-757, Feb 2006
7. Schmalzried, P. T., Campbell, P., Schmitt, K. A., Brown, C. I., Amstutz, C. H., Shapes and Dimensional Characteristics of Polyethylene Wear Particles Generated In vivo by Total Knee Replacements Compared to Total Hip Replacements, Journal of Biomedical Materials Research, 38(3): 203-210, Dec 1998
8. Revell, P. A., al Saffar, N., Kobayashi, A., Biological Reaction to Debris in Relation to Joint Prostheses, Proc Inst Mech Eng, 211: 187-197, 1997
9. Oberdörster, G., Pulmonary Effects of Inhaled Ultra fine Particles, International Archives of Occupational and Environmental Health, 74(1): 1-8, Feb 2004
10. Schultz, H., Harder, V., Mulli Ibald, A., Khandoga, A., Koenig, W., Krombach, F., Radykewicz, R., Stampfl, A., Thorand, B., Peters, A., Cardiovascular Effects of Fine and Ultrafine Particles, Journal of Aerosol Medicine,18(1): 1-22, 2005
11. Massolo, L., Müller, A., Tueros, M., Rehwagen, M., Franck, U., Ronco, A., Herbarth, O., Assessment of Mutagenicity and Toxicity of Different –Size Fractions of Air Particulates from La Plata, Argentina and Leipzig, Germany, Environmental Toxicology, 17(3): 219-231, Jul 2002
12. Soto, K., Garza, K. M., Murr, L. E., Cytotoxic Effects of Aggregated Nanomaterials, Acta Biomaterials, 3(3): 351-358, May 2007
13. Kipen, M. H., Laskin, L.D., Smaller is not always better: nanotechnology yields nanotoxicology, Am J Physiol Lung Cell Mol Physiol, 289: 696-697, 2005
14. Chen, Z., Meng, H., Xing, G., Chen, C., Zhao, Y., Jia, G., Wang, T., Yuan, H., Ye, C., Zhao, F., Chai, Z., Zhu, C., Fang, X., Ma, B., Wan, L., Acute Toxicological Effects of Copper Nanoparticles Invivo, Toxicology Letters, 163(2): 109-120, May 2006
15. Ebbesen, M., Jensen, T. G., Nanomedicine: Techniques, Potentials and Ethical Implications, J Biomed Biotechnol, 5, 2006
16. Chan, V. S., Nanomedicine: An Unresolved Regulatory issue, Regul Toxicol Pharmacol, 46(3): 218-224, Dec 2006
17. Stern, S, T., McNeil, S. E., Nanotechnology Safety Concerns Revisited, Toxicol Sci, Jul 2007
18. Romberg, B., Hennink, W. E., Storm, G., Sheddable Coatings for Long- Circulating Nanoparticles, Pharm Res, Jun 2007
19. Gorman, J., Taming High-Tech Particles Cautious Step into the Nanotech Future, Science News, 161(13): 200, Mar 2003
20. Goho, A., Buckyballs at Bat: Toxic Nanomaterials get a Tune-up, Science News, 166(14), Oct 2004
21. Gao, J., Liang, G., Zhang, B., Kuang, Y., Zhang, X., Xu, B., FePt@ CoS2 Yolk-Shell Nanocrystals as a Potent Agent to Kill HeLa Cells, J. Am. Chem. Soc, 129(5): 1428-1433, Jan 2007
22. Grassian, H. V., O’Shaughnessy, T. P., Adamcakova- Dodd, A., Pettibone, M. J., Thorne, S. P., Inhalation Exposure Study of Titanium Dioxide Nanoparticles with a primary Particle Size of 2 to 5 nm, Environmental Health Perspectives, 115(3): 397-402, Mar 2007
23. Brown, D. M., Wilson, M. R., Macnee, W., Stone, V., Donaldson, K., Size-Dependent Proinflammatory Effects of Ultrafine Polystyrene Particles: A Role for Surface Area and Oxidative Stress in the Enhanced Activity of Ultrafines, Toxicology and Applied Pharmacology, 175(3): 191-199, Sep 2001
24. Hoet, H.M. P., Brüske-Hohlfeld, I., Salata, V. O., Nanoparticles- known and unknown health risks, Journal of Nanobiotechnology, 2(12), Dec 2004
25. Medina, C., Santos-Martinez, M. J., Radomski, A., Corrigan, O.I., Radomski, M.W., Nanoparticles: Pahrmacological and Toxicological Significance, British Journal of Pharmacology, 150: 552-558, 2007
26. Wickline, S.A., Lanza, G.M., Nanotechnology for Molecular Imaging and Targeted Therapy, Circulation, 107: 1092-1095, 2003
27. Subramanian, P., Ainsworth, P., Cassey, J., Phelan, D., Lost bits: Particle Shedding with Polyvinyl Chloride Intravenous Administration Sets, Pediatr Surg Int, 18(8): 658-661, Dec 2002
28. Peters, A., Particulate Matter and Heart Disease: Evidence from Epidemiological Studies, Toxicology and Applied Pharmacology, 207: 477-482, 2005
29. Puntis, J. W.L., Wilkins, K.M., Ball, Hazards of Parenteral Treatment: Do Particles Count? , Archives of Disease in Childhood, 67: 1475-1477, 1992
30. Shannon, P., Billbao, J.M., Marotta, T., Terbrugge, K., Inadvertent Foreign Body Embolization in Diagnostic and Therapeutic Cerebral Angiography, AJNR Am J Neuroradiol, 27: 278-282, Feb 2006
31. Whelan, D.M., van Beusekom, H.M.M., van der DGiessen, W.J., Foreign Body Contamination During Stent Implantation, Catheterization and Cardiovascular Diagnosis, 40: 328-332, 1997
32. Chapot, R., Wassef, M., Bisdorff, A., Rogopoulos, A., Merland, J.J., Houdart, E., Occlusion of the Middle Cerebral Artery due to Synthetic Fibres, AJNR Am J Neuroradiol, 27: 148-150, Jan 2006
33. Barnwell, L, S., D’Agostino, N. A., Shapiro, L,S., Nesbit, M, G., Kellogg, X. J., Foreign Bodies in Small Arteries After Use of an Infusion Microcatheter, AJNR, 18: 1886-1889, Nov 1997
34. Soeda, A., Sakai, H., et al, Thromboembolic Events Associated with Guglielmi Detachable Coil Embolization of Asymptomatic Cerebral Aneurysms: Evaluation of 66 Consecutive Cases with Use of Diffusion-Weighted MR Imaging, AJNR Am J Neuroradiol, 24: 127-132, 2003
35. ASTM F04.30.06, Interventional Cardiology Task Group
36. ISO/TC 150/SC 2/WG 03, Vascular prostheses and Task Force 3 for the development of ISO 25539-3 on vena cava filters, 2007
37. AAMI/DP, Medical Device Particulate Committee, 2007
38. ISO/CD 25539-2, Cardiovascular Implants- Endovascular Devices-Part 2:Vascular Stents, 2006
39. ISO/WD 25539-2.2 A, Attributes of Endovascular Devices- Technical and Clinical Considerations
40. ASTM F2477-07, Standard Test Methods for In Vitro Pulsatile Durability Testing of Vascular Stents, 2007
41. ASTM WK6315, Standard Guide for Assessing the Acute Coating Durability of Polymer-Coated Drug Eluting Vascular Stents, 2007
42. USP 788, Particulate Matter in Injections
43. ASTM F658-00a, Standard Practice for Calibration of a Liquid Borne Particle Counter Using an Optical System Based Upon Light Extinction
44. Conti, J.C., A comprehensive Protocol and Procedural Considerations Designed to Evaluate the Shedding of Particles from Drug Eluting Stents, Materials and Processes for Medical Devices, Palm Desert, CA, 2007
Biomedical Sciences Instrumentation, (2009)

