High Speed Photographic Verification of Intravascular Stent Strains During …
Mock Artery Compliance
by | RMBS 2004 | Publications, Compliance, High Speed Photography
High Speed Photographic Verification of Intravascular Stent Strains During Accelerated Durability Testing
Biomedical Science Instrumentation, 40, pp. 219-224, (2004)
Kattelola, Brunda1, Conti, JC2, Strope, ER
Dynatek Dalta Scientific Instruments, 105 E. Fourth, Galena, Missouri, 65656
1 University of Kansas, Department of Mechanical Engineering, Lawrence KS , 66046
2 Department of Physics, Astronomy and, Material Sciences, Southwest Missouri State University, Springfield, Missouri, 65803
RMBS 2004
Keywords:
Stent, Durability, Vascular, Intravascular, Verification, Strain, High Speed Photographic, Mock Artery and Silicone.
Abstract
Most stent durability testing does not predict resulting clinical failures. Standards committees have taken on the task of generating more reliable test protocols. Currently, the AAMI/ISO Committee has chosen an experimental direction that allows an investigator to test at ultra high frequencies (above 1000 bpm) as long as the actual strain of the stents can be verified to be moving the same amount per cycle that they do during real time testing (70 to 72 bpm). We have developed a series of techniques and protocols utilizing high-speed photographic analysis to accomplish this. The first aspect requires the utilization of ultra clear silicone mock arteries. It is important that optical anomalies do not cause aberrations in the analysis. Next is the relationship between the angle of the incident lighting and the positioning of the camera in front of the pulsing tube. Finally, a unique set of marking techniques which are used as tracking locations for the automatic measurement systems located in the software of the camera have certain characteristics that are important with respect to accurate measurements. In each case the particular setup must have independent verification of the accuracy of the measurements. We will review these variables and demonstrate how this system can be utilized to verify strains of the inside wall, outside wall, and stent.
Introduction
Durability studies have gradually increased in pulse rate to the point where the international standards organizations have developed new standards requiring verification of targeted strains. (1,2) This work addresses the use of high speed photography to accomplish this requirement.
Materials and Methods
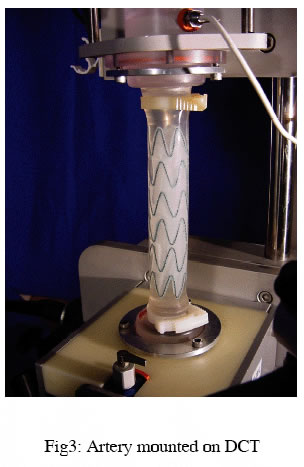
1) Dynamic Compliance tester: The DCT3 has a speed-controlled motor that turns a shaft on which is mounted an adjustable eccentric coupler. The coupler, in conjunction with the crank arm, converts the rotational motion into linear motion that compresses a bellows. The drive rod that compresses the bellows is connected to a highly sensitive LVDT. A proximal graft connection port is located at the discharge end of the bellows, while a distal port is located at the upper end of the instrument and attached to both a constant force device to eliminate buckling and a pressure transducer port.
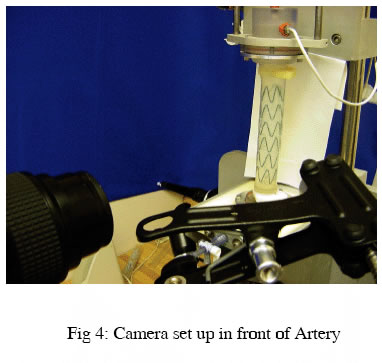
2) High Speed Camera: FastCam PCI 1280 Camera (High Speed Imaging) and Photron Motion Tools Software Version 1.05 (Photron USA, Inc) were used for camera measurements. (Lens: 105 mm, f2.8 w/Micro) Photron Motion Tools software is modular software that has the capability of analyzing the motion within the image. The images could be analyzed using one of the two tracking methods: Auto Tracking Method and Manual Tracking Method. (Repeatability: Automatic ~ 0.2 display pixels, manual < 2 display pixels).
Camera Variables:
- Frame Rate: The software has different frame rates from 125 to 4000.
- Shutter Speed: The amount of time the electronic shutter is open during each frame is defined as shutter speed. Large shutter speeds results in blurry images.
- Resolution: The highest resolution is 1280×1036 pixels.
- Pre and Post Trigger: Pre and post trigger defines the percentage of images to be recorded before and after the trigger is clicked.
- Pixel: Single pixel is equivalent to one square unit of the scope.
- Camera Calibration: The data can be described either in pixels or real time units. To use real time dimensions like mm, the camera is calibrated using a NIST traceable machinist’s pin. The calibrating file cannot be applied universally. Each time the camera position or zoom is varied or if the camera is disturbed unintentionally, the calibration will no longer be valid.
3) Ultra Clear Silicone Mock Artery (specimen #1): outside diameter: 28.12 mm, inside diameter: 22.55 mm.
4) Intravascular Stent Graft (specimen #2): was 8cm in length.
Measurement Theory:
Chord Theory: By this method, the strain in the tube is calculated using 2 points.
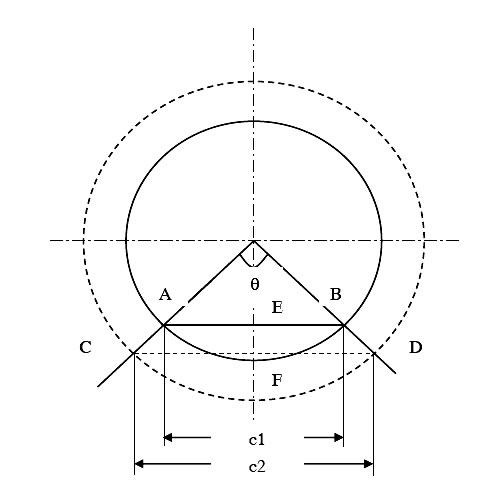
Fig [1] Tube pulsed from lower pressure to higher pressure.
Select two points Ai and Bi on the circle such that the arc AiBi subtends an angle Θ at the center of the circle as shown in the Fig 1. Let ci be the initial length of the chord AiBi.
So:
Ci = 2 sin (Θ/2) ri
As the mock artery is being pulsed from lower pressure to higher pressure, let Af and Bf be the final positions of points Ai and Bi respectively and rf be the final radius. Let the distance between Af and Bf be cf. The % strain (%Є) in the chord length is given by change in the chord length divided by the original chord length.
% Є = ((cf-ci)100)/ci
But cf = 2 sin (Θ/2) rf
Therefore, % Є =(rf – ri)/ ri
Consider a circle of radius r, with center R. AB is the chord, length = c1
From Fig [1]:
Initial conditions
Initial chord length (AB), c1=2*sin (q/2)*ri Equation 1.
(By Pythagoras theorem, sin (angle) = opp. side/ hypotenuse)
When tube is pulsed to a higher pressure, the radius of the tube increases.
Final Conditions
Final chord length (CD), c2 = 2*sin (q/2)*rf Equation 2.
Strain in the chord length = change in chord length to original chord length.
= > strain = (c2-c1)/c1 Equation 3.
From Equation 1 and 2, by substituting the values of c1 and c2,
Strain in chord length = (rf – ri) / ri
Hence the strain in chord length is equivalent to radial strain.
Radial Theory: In contrast to the chord theory, radial theory uses a single point to calculate strains by considering single point motion. From Fig [2], at zero pressure: the radius (RB) of the tube is known. By taking a static image of the tube, the distance AB is computed. The angle of the line segment RB formed at the center of the circle can be calculated as:
sin (q)= AB/RB Equation 4.
If the angle q remains constant when the tube is pulsed from zero to 80 to 120, then by symmetry of triangles in Fig [2]
sin (q)= AB/RB= CD/RD= EF/ RF. Equation 5.
Camera views the three-dimensional tube as a two-dimensional plane figure and thus when the tube is pulsed, the linear motion of point in x and y directions are tracked. The linear distance CD and EF can be determined by taking the image of the tube at 80-and120 mm of Hg respectively.
The radius of the tube at 80 mm of Hg, RD= CD/ sin(q)
The radius of the tube at 120 mm of Hg, RF= EF/ sin(q).
% Radial strain = 100*(RD-RB)/RB
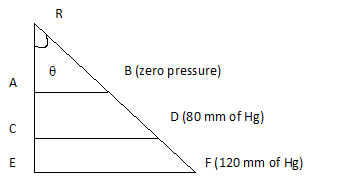
Fig [2]: Tube of radius RB (@ 0 pressure) pulsed from 80 to 120 mmHg
Specimen Preparation: Specimen #1 was cut to 10 cm in length. The dimensions of specimen #1 (i.e. inner diameter, outer diameter, and wall thickness of the tube) were determined using LASER MIKE 183B. Three sets of points on the inside wall and four sets of points on the outside wall of specimen #1 were marked using silicone paint and permanent marker respectively. The points were marked 5 mm away from each of the diametrical ends. The tube is then carefully put aside for the ink to dry. No markings were made on specimen #2.
Specimen Mounting: The DCT machine is pressure calibrated using a mercury manometer followed by a volume calibration. The mock artery was then mounted on the two ports. Clamps prevent slipping and reduce the number of air inclusions. The mock artery was mounted with enough longitudinal tension to prevent buckling. It was then filled with distilled water and the stroke length of the compliance tester was adjusted so that the minimum and maximum pressure varied between either 0 and 120 or 80 and 120 mmHg. The diastolic pressure in the mock artery was adjusted by either adding or removing distilled water. The artery was then pulsed once before setting up the camera and other camera related equipment. This was done to make sure that the pressure differential in the artery was achieved and no major adjustments would be required after setting the camera. However, during the experiment when the pressure differential in the artery changed, fine adjustments were made by adding/removing distilled water with the aid of a graduated syringe. The same procedure as described above was used for mounting the mock artery containing the intravascular stent.
Camera Mounting: The camera was adjusted to sit plumb and level on the stand. The camera lens and light source were then adjusted to give the best possible image of the artery. The light source was adjusted so that the there was no glare in the image and the portion of the artery in focus had approximately equivalent amount of light on it. A trial image of the artery was taken to ensure that the artery was precisely centered within the scope of the camera. Once adjusted, care was taken not to disturb the camera, zoom, focus, or the light source, or any other variable associated with the camera. All the measurements were taken at 500 fps, 1280x 1036 resolution, and 1/500 sec shutter speed.
Measurements: While pulsing the mock artery or mock artery-intravascular stent combination a) 0 to120 mmHg or b) 80 to 120 mmHg at 72 bpm, a video of the moving artery/ stent was recorded. At least 1.5 full cycles were recorded for each experiment.
Experiments:
Test 1: Five sets of data were collected evaluating the outside diameter of the silicone mock artery at each of the two pressure excursions (i.e., 120/0 and 120/80mm of Hg). Results from both manual and automated tracking were compared.
Test 2: To evaluate the relationship between the strains on the inside and outside wall of the mock artery, five sets of data were @ 120/0 mmHg.
Test 3: To investigate the intravascular stent graft strains, five sets of data were collected by pulsing the graft at the two pressure excursions (i.e.,. 120/0 and 120/80 mmHg.)
Results
Data Analysis:
For the mock artery two points were tracked using automatic and manual tracking techniques. The data points were then exported to a spreadsheet and the data was analyzed as shown below.
For the stent two apical points were chosen and movement between them monitored. In these analyses all data was stored as pixels. The following results express % change in radial direction. The average % change in outside diameter of the tube at 120/0 was 2.57 ± 0.04% automatic tracking and manual tracking measurements of 2.51 ± 0.06 %. For a pressure excursion of 120/80, the average % strain were computed to be 2.89 ± 0.19 % and 2.47 ± 0.21 % by using automatic and manual tracking methods respectively (Table 1).
| 120/0 mm of Hg | 120/80 mmHg | |||
| Auto | Manual | Auto | Manual | |
| 1 | 2.54 | 2.5 | 2.80 | 2.57 |
| 2 | 2.62 | 2.48 | 3.24 | |
| 3 | 2.54 | 2.41 | 2.80 | 2.57 |
| 4 | 2.62 | 2.56 | 2.80 | 2.57 |
| 5 | 2.54 | 2.55 | 2.80 | 2.14 |
| Mean | 2.57 | 2.51 | 2.89 | 2.47 |
| Std dev | 0.04 | 0.06 | 0.19 | 0.21 |
Table [1]: Strains on the outside wall of mock artery.
| Run # | Set 1 | Set 2 | Set 3 | Set 4 |
| 1 | 2.86 | 2.90 | 2.84 | 2.81 |
| 2 | 2.88 | 2.90 | 2.90 | 2.78 |
| 3 | 2.91 | 2.96 | 2.77 | 2.94 |
| 4 | 2.78 | 2.88 | 2.66 | 2.75 |
| 5 | 2.84 | 2.87 | 2.80 | 2.87 |
| Mean | 2.85 | 2.90 | 2.79 | 2.83 |
| Std dev | 0.04 | 0.03 | 0.08 | 0.07 |
Table [2]: Strains on the outside wall at 120/0 mmHg by automatic tracking.
Inside Wall vs. Outside Wall of the Artery
At 120/80 the inside wall of the artery underwent average strain percentages of 3.23 ± 0.34 %, 3.31 ± 0.18, % 3.21 ± 0.38 % respectively for three sets of points (Table 3). For the same pressure excursion the outside wall of the artery experienced average percent strains of 2.85±0.04 %, 2.90±0.03 %, 2.79± 0.08%, 2.83±0.07 % for four sets of points (Table 2).
| Run # | Set 1 | Set 2 | Set 3 | |||
| 120/0 | 120/80 | 120/0 | 120/80 | 120/0 | 120/80 | |
| 1 | 3.69 | 3.06 | 2.66 | 3.48 | BAD VALUE | 2.99 |
| 2 | 3.84 | 3.57 | 3.44 | 3.44 | 4.04 | 3.03 |
| 3 | 3.03 | 2.99 | 3.48 | 3.26 | 4.02 | 3.06 |
| 4 | 4.32 | 3.64 | 3.84 | 3.07 | 3.76 | 3.07 |
| 5 | 4.75 | 2.91 | 3.73 | 3.74 | 3.90 | |
| Mean | 3.93 | 3.23 | 3.43 | 3.31 | 3.89 | 3.21 |
| Std dev | 0.65 | 0.34 | 0.46 | 0.18 | 0.16 | 0.38 |
Table [3]: Strains on the inside wall of the silicone mock artery at 120/0 mmHg & 120/80 mmHg.
| Run no | 120/0 | 120/80 |
| 1 | 2.68 | 7.3 |
| 2 | 4.13 | 5.36 |
| 3 | 4.09 | 4.36 |
| 4 | 2.72 | 5.01 |
| 5 | 2.16 | 2.7 |
| Mean | 3.16 | 4.946 |
| Std Dev | 0.89 | 1.666 |
Table [4]: Strains on the stent inside silicone mock artery at 120/0 mmHg and120/80 mmHg.
Strains on the stent: The average strains experienced by the stent graft were calculated to be 3.16 ± 0.89 %, 4.946 ± 1.66 % at 120/0 and 120/80 pressure excursions respectively. From table [4], it can be observed that the stent did not undergo the same magnitude of strains for five continuous runs.
Conclusion
Manual versus automatic tracking gives similar results. The extent of pressure excursions does have an impact on the degree of strain found using compliance instruments and the high-speed photographic technique. Inside compliance is greater than outside compliance as found by high-speed photography and previous studies (2, 3). This high speed photographic procedure allows for the validation of mock arteries or intravascular stent strain during durability testing.
References
1) AAMI/ISO standard ISO/CD-V-1 25539-01:2003
2) AAMI/ISO standard ISO/CD-V-1 25539-01:2003 A1
3) Weinberg S., et al. The Experimental Relationship Between Volumetric, Diametric, and Longitudinal Compliance of Vascular Implants. Transactions: Sixth World Biomaterials Congress, 2000 p. 535.

